ChartPros Market Insights
Trading All Time Highs


Trading all time highs demands more precision when historical reference points begin to disappear.
This Market Insights replay shows traders how to estimate upside targets, identify lower highs, and manage risk when price pushes into less familiar territory.
It also includes a real NVIDIA example to demonstrate how Fibonacci-based analysis can help traders approach all time highs with more confidence, consistency, and a rules-based plan.
CASE STUDY: Trying to Pass Your Funded Trading Challenge?
We frequently get asked about various funded trading programs and we've reviewed plenty of them but historically never participated in or recommended any of them.
Until recently.
Navigating the Markets with Price Action Technical Analysis: Expert Tips for Successful Stocks, Options, Futures, Forex, Crypto, and Commodity Trading


Price action technical analysis is a popular and effective approach to navigating the financial markets, including stocks, options, futures, Forex, Crypto, and Commodity trading.
This article will provide expert tips and insights to help you successfully trade various financial instruments using price action technical analysis. By understanding and applying these concepts, you can improve your trading skills and potentially achieve greater profitability.
May 17 Chart of the Day - Union Pacific
Union Pacific Railroad (UNP) is the second largest railroad in the U.S. that operates 8,300 locomotives over 32,200 miles with routes in 23 U.S. states west of Chicago and New Orleans.
The company was in some headlines this week that touted "unusual options activity" in their stock but honestly after reviewing the report we deemed it to be somewhat of a "click bait" headline.
We decided to review their chart from a price action technical analysis perspective nonetheless.
May 4 Chart of the Day - Apple

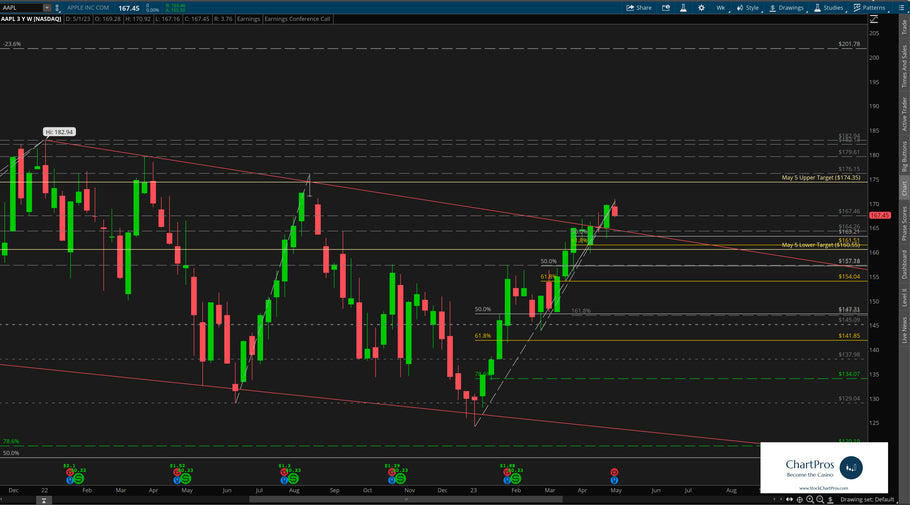
How High Can the Markets Go?

We frequently get asked "How High Can the Markets Go?"
The true answer is no one really knows for sure but technical analysis can help determine potential targets.
Once a market reaches its target there's no telling what can happen then. The prudent thing as a trader is to allow it time to develop new structure.
Price Targets for Oil - $100??


Remember last year when Oil (symbol /CL) went under $7 a barrel? Well if you got long then and stayed long you would have about10x return now...
We hear woulda, shoulda, coulda a lot.
Here are some updated higher time frame upside price targets for Oil. It's not out of the question to see $100 technically speaking.
Discover Top Trading Psychology & Mindset Techniques Webinar Recording


Introduction to the Trade Entry Timing Tool - FREE Webinar Recording


Market Calm Before the Election Storm... What to Anticipate


Advanced Futures Course with Michael Perrigo


ChartPros launched its latest market education leading course "Advanced Futures".
This course takes traders through advanced strategies and preparations for trading indice futures.
The course is broken into three sections and will walk traders through step by step some of the most advanced strategies and techniques for day and swing trading.
Traders are going to learn how to identify Fibonacci sequences used by institutional algorithms and how to leverage that knowledge in your trading.
We're also going to provide insights into risk management and how to create "risk free" trade scenarios.
Lastly, we take traders through some trade planning and trade recaps that apply the techniques taught in the course.
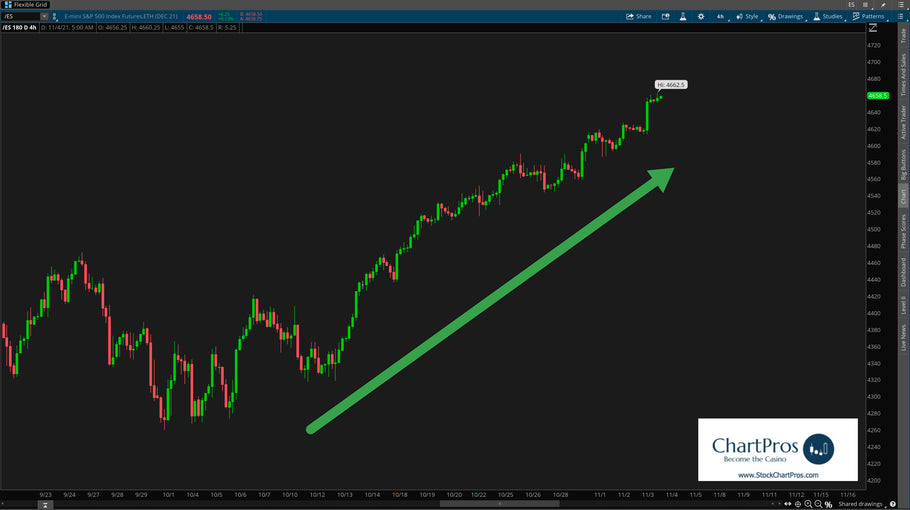
Indices Futures Charts and Video Analysis


We wanted to do this higher time frame daily futures grid and video for you on ES, NQ, and YM.
You’ll notice that nothing goes below the daily so not likely to be useful on intraday trades.
- Page 1 of 2
- Next page