ChartPros Market Insights
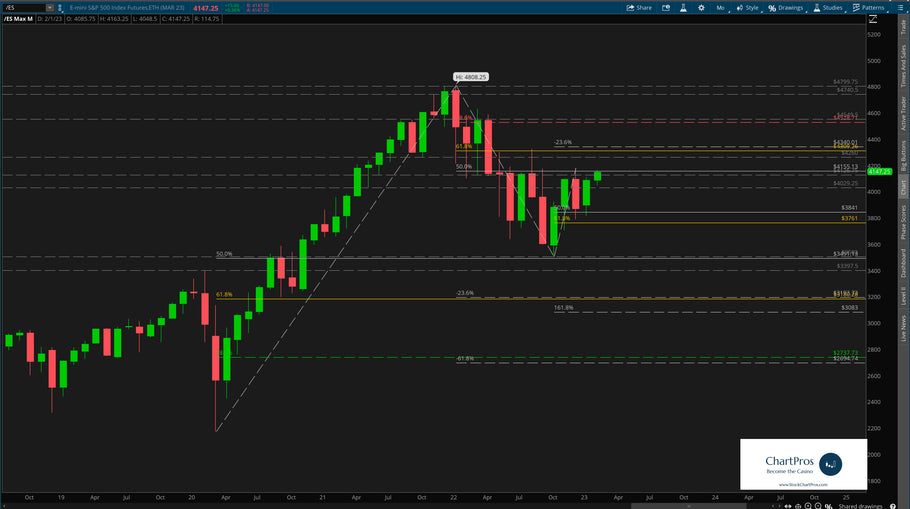
June 12 Chart of the Day - S&P 500 Update
One of the most frequently asked questions we get is:
Can the markets keep going higher?
The short answer is:
YES... It’s possible because the S&P 500 ticker /ES still has potential higher time frame targets in play.
Today we simply present multiple time frame charts as they speak for themselves...
March 20 Chart of the Day - S&P 500 before FOMC Meeting
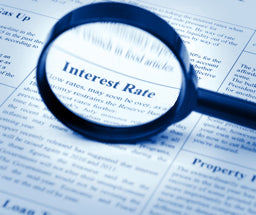
Today at 2pm eastern the US Federal Reserve will announce its decision on whether or not to change interest rates. The announcement is followed by a press conference with Fed Chair Jay Powell.
Seems like each one of these interest rate, inflation, or employment related news days lately brings with it more and more volatility with the same old question of "how much higher can the markets go?"
See our planning charts BEFORE the FOMC announcement.
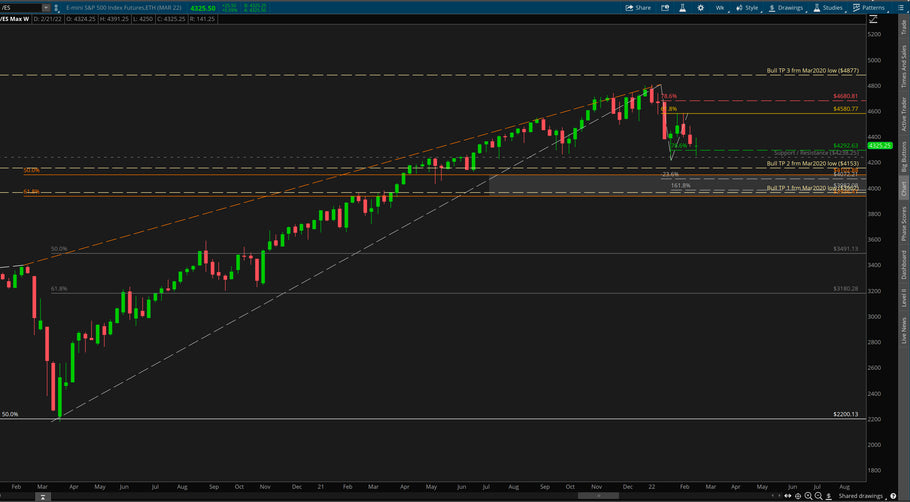
December 13 Chart of the Day - S&P 500

Once again the S&P 500 (/ES) is our chart of the day ahead of the final scheduled news catalyst for 2023 - the FOMC Statement and follow up press conference with Fed Chair Jerome Powell starting at 2pm eastern today.
Last FOMC Day the S&P 500 futures (ticker /ES) initially spiked up 15 points, spiked down 20 points, then surged 45 points all in the 2hrs after the FOMC statement and follow up press conference.
Be prepared for similar volatility this afternoon... before then anticipate potential choppy or sideways price action.
Is the S&P 500 Bear Market Over?

By definition, a bear market is when price drops 20% or more from its recent or all time highs. So for the S&P 500 ticker /ES one could say that technically speaking the bear market is over because price is now approximately 15% off the all time high set back in October 2021.
But is the recent run up simply a "Bear Market Rally" or are the bulls firmly back in charge gunning for new all time highs? See this before your next trade!
FOMC Day = Volatility!


S&P 500 Market - Higher Timeframe Technical Analysis

New Year Resolutions for Traders

But what about your trading? Have you made resolutions before? Like have more discipline? More patience? Stop chasing trades? Some may even consider quitting trading altogether? Read more...
How High Can the Markets Go?

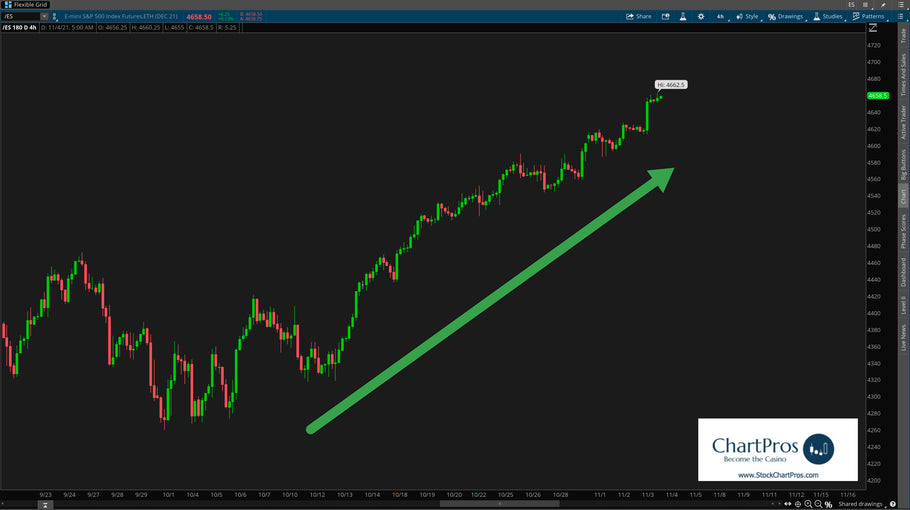
We frequently get asked "How High Can the Markets Go?"
The true answer is no one really knows for sure but technical analysis can help determine potential targets.
Once a market reaches its target there's no telling what can happen then. The prudent thing as a trader is to allow it time to develop new structure.
Is the Market About to Crash?


Around the Markets - 2 minute outlook for the week of November 15, 2020


Market Calm Before the Election Storm... What to Anticipate


Advanced Futures Course with Michael Perrigo


ChartPros launched its latest market education leading course "Advanced Futures".
This course takes traders through advanced strategies and preparations for trading indice futures.
The course is broken into three sections and will walk traders through step by step some of the most advanced strategies and techniques for day and swing trading.
Traders are going to learn how to identify Fibonacci sequences used by institutional algorithms and how to leverage that knowledge in your trading.
We're also going to provide insights into risk management and how to create "risk free" trade scenarios.
Lastly, we take traders through some trade planning and trade recaps that apply the techniques taught in the course.
- Page 1 of 2
- Next page