ChartPros Market Insights
Trading All Time Highs


Trading all time highs demands more precision when historical reference points begin to disappear.
This Market Insights replay shows traders how to estimate upside targets, identify lower highs, and manage risk when price pushes into less familiar territory.
It also includes a real NVIDIA example to demonstrate how Fibonacci-based analysis can help traders approach all time highs with more confidence, consistency, and a rules-based plan.
How to Know When to Enter a Trade


A frequently asked question I routinely get is “Tom, when you have multiple levels of support/resistance, trend, or fibs how do you know which is the best level to use to get into a trade?”
The simple answer is I don’t. Nor, with any certainty does, anyone else.
“So what do you do” becomes the follow up question.
May 8 Chart of the Day - UPDATE for Disney earnings


Here's just one example of the powerful benefits traders get for free from ChartPros!
Chart UPDATE for Disney (DIS)
Price Soared to Anticipated Level!
I NEVER Believed in Technical Analysis Until I Realized This...


ChartPros founder Tom Winterstein (pictured here in the mid 1980's) reveals the breakthrough moment in his trading career that led him to master price action technical analysis and provides- Proof in Action: A Real-World Example!
Earn Your Price Action Trader Certification in 90 Days!


This program offers a "blended learning" approach, combining self-paced eLearning with expert-led sessions, allowing traders to access the online component immediately upon acceptance.
CASE STUDY: Trying to Pass Your Funded Trading Challenge?
We frequently get asked about various funded trading programs and we've reviewed plenty of them but historically never participated in or recommended any of them.
Until recently.
This is What I'm Binge Watching this Weekend


What I Like to Binge Watch:
- Billions (the hit series on Showtime)
- Shark Tank
- Blue Bloods (my dad is a retired police officer)
- Trading Education Courses...
Yes, Trading Education Courses!
See which ones...
The Top Reasons Why Traders Fail and How to Overcome Common Pitfalls with Effective Trading Rules


This article delves deep into the top reasons why traders fail and how you can overcome these challenges by focusing on your trading process of implementing trading rules, plans, and trading psychology rather than focusing on the outcomes of profits.
Navigating the Markets with Price Action Technical Analysis: Expert Tips for Successful Stocks, Options, Futures, Forex, Crypto, and Commodity Trading


Price action technical analysis is a popular and effective approach to navigating the financial markets, including stocks, options, futures, Forex, Crypto, and Commodity trading.
This article will provide expert tips and insights to help you successfully trade various financial instruments using price action technical analysis. By understanding and applying these concepts, you can improve your trading skills and potentially achieve greater profitability.
Have You Ever Thought About Quitting Your Job to Trade Full Time?


Trading is not easy, but can be life changing.
We seldom meet a trader who isn't passionate about generating supplemental income, or even better, someone who desires to quit their day job to become a full time trader.
But many find that can be easy to say but hard to do.
See How This ChartPros Trade Room Member Used Apex Trader Funding to Earn Over $1M in the last year!


Vince Koehn, a long time ChartPros Trade Room member talks about his success with Apex Funded Trader program.
We frequently get asked about various funded trading programs and we've reviewed plenty of them but historically never participated in or recommended any of them.
Until recently.
May 30 Chart of the Day - S&P 500

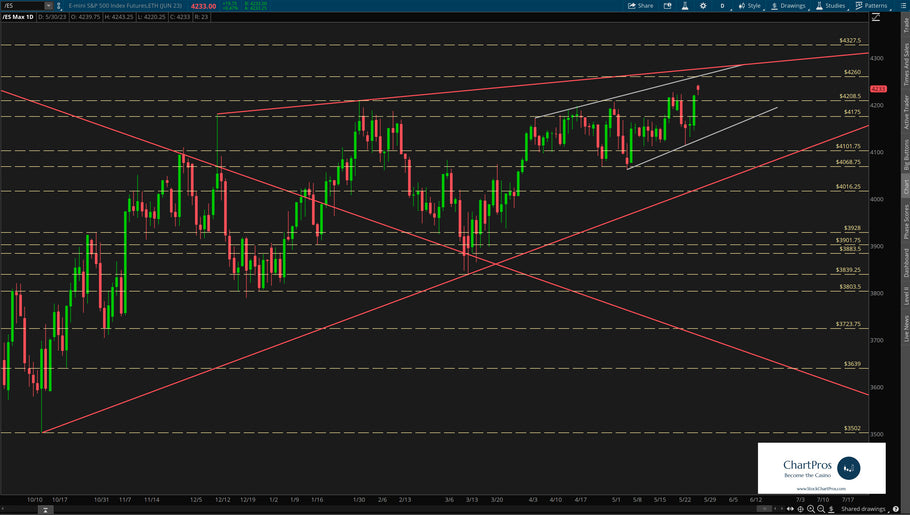
While the New York Stock Exchange (NYSE) was closed Monday in observance of Memorial Day the global after-hours electronic trading system (GLOBEX) opened as normal Sunday evening at 6pm eastern time. And given the US debt ceiling headline news over the long weekend the S&P 500 futures ticker /ES gapped up about 20 points on the open to keep the bulls firmly in control.
On the current ES weekly chart I've only marked it up with Support/Resistance and Trend. Also known as basic structure. In this view traders can see that price often ping pongs between historical levels before proceeding in its next direction.
- Page 1 of 4
- Next page