ChartPros Market Insights
Trading All Time Highs


Trading all time highs demands more precision when historical reference points begin to disappear.
This Market Insights replay shows traders how to estimate upside targets, identify lower highs, and manage risk when price pushes into less familiar territory.
It also includes a real NVIDIA example to demonstrate how Fibonacci-based analysis can help traders approach all time highs with more confidence, consistency, and a rules-based plan.
CASE STUDY: Trying to Pass Your Funded Trading Challenge?
We frequently get asked about various funded trading programs and we've reviewed plenty of them but historically never participated in or recommended any of them.
Until recently.
March 21 Chart of the Day - Ansys
Ansys (ANSS), a NASDAQ 100 company, develops and markets CAE/multiphysics engineering simulation software for product design, testing and operation and offers its products and services to customers worldwide.
The company made headlines this week by announcing they recently strengthened their collaboration with NVIDIA (NVDA) to boost the advancement of simulation solutions backed by pioneering technologies like computing and generative AI.
With this in mind we set out to review their chart from a price action technical analysis perspective.
December 15 Chart of the Day - Nasdaq 100 Index Upside Targets
As you and many other traders with ambitious income goals may have recently noticed several equities and indexes are at or near their all time highs (ATH).
Today we'll take another look at the Nasdaq 100 futures index (/NQ) in an attempt to answer the question "where could price be heading."
To help us, we recently dusted off and pulled from our vault a previous FREE Market Insights Briefing titled "All Time Highs - to trade or not trade."
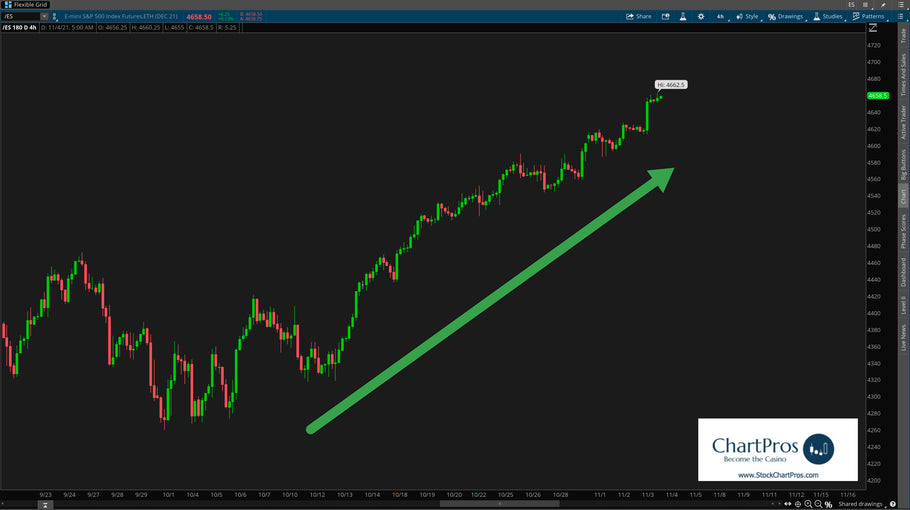
November 22 Chart of the Day - NASDAQ
Today we turn our focus on the NASDAQ futures (ticker /NQ) and one of the important questions we continuously try to answer is: Where could price go?
This is totally different than predicting or calling tops or bottoms. Once we've determined the answers based on price action technical analysis tools then we develop our "battle plan" chart.
One that includes the price levels in both directions from which we create pre-determined trade plans.
See the answers we've come up with so far!
How High Can the Markets Go?

We frequently get asked "How High Can the Markets Go?"
The true answer is no one really knows for sure but technical analysis can help determine potential targets.
Once a market reaches its target there's no telling what can happen then. The prudent thing as a trader is to allow it time to develop new structure.
Around the Markets - 2 minute outlook for the week of January 31, 2021

Around the Markets - 2 minute outlook for the week of November 15, 2020


Market Calm Before the Election Storm... What to Anticipate


Advanced Futures Course with Michael Perrigo


ChartPros launched its latest market education leading course "Advanced Futures".
This course takes traders through advanced strategies and preparations for trading indice futures.
The course is broken into three sections and will walk traders through step by step some of the most advanced strategies and techniques for day and swing trading.
Traders are going to learn how to identify Fibonacci sequences used by institutional algorithms and how to leverage that knowledge in your trading.
We're also going to provide insights into risk management and how to create "risk free" trade scenarios.
Lastly, we take traders through some trade planning and trade recaps that apply the techniques taught in the course.
How to Use 5 Price Action Tools to Boost Your Confidence and Improve Your Consistency


Indices Futures Charts and Video Analysis


We wanted to do this higher time frame daily futures grid and video for you on ES, NQ, and YM.
You’ll notice that nothing goes below the daily so not likely to be useful on intraday trades.
- Page 1 of 2
- Next page