ChartPros Market Insights
S&P 500 Market - Higher Timeframe Technical Analysis

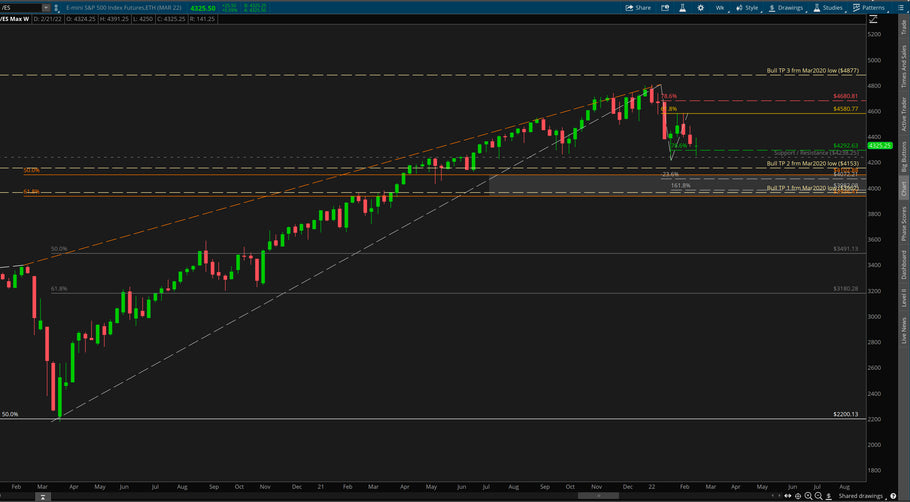
How High Can the Markets Go?

We frequently get asked "How High Can the Markets Go?"
The true answer is no one really knows for sure but technical analysis can help determine potential targets.
Once a market reaches its target there's no telling what can happen then. The prudent thing as a trader is to allow it time to develop new structure.
Price Targets for Oil - $100??


Remember last year when Oil (symbol /CL) went under $7 a barrel? Well if you got long then and stayed long you would have about10x return now...
We hear woulda, shoulda, coulda a lot.
Here are some updated higher time frame upside price targets for Oil. It's not out of the question to see $100 technically speaking.
Trade Using Only Support/Resistance and Trend


Around the Markets - 2 minute outlook for the week of November 15, 2020


Indices Futures Charts and Video Analysis


We wanted to do this higher time frame daily futures grid and video for you on ES, NQ, and YM.
You’ll notice that nothing goes below the daily so not likely to be useful on intraday trades.
Could be an Interesting week or two for /YM


The traders in our Price Action Mastery Course are learning first hand the power of the markets and in particular how technical analysis can benefit them.
During the first week of April we identified a level for a long swing trade entry. Since then we've been tracking and managing the trade. Now, as price is approaching our bull profit targets it will be interesting to see how price reacts to what could be potential resistance.
Yes, that's about a 4000+ point hold to the long side. This is what is taught in the course for both swing and shorter term trades. It is not uncommon for us to be long in our swing account but short in our intraday account to capitalize on the levels of interest we've identified for the respective time frames.
How Low Can Oil Go???? Yeah, See How Low...


Some oil producers are *paying* customers to accept their output. Say what?!?! Yeah, it's true.
But let's focus on the futures contract, June in particular. We're already hearing stories about hedge fund managers being wiped out tryin to call a bottom. That's unfortunate.
We're not in the prediction business of calling tops or bottoms rather, we're in the reaction business to technical analysis levels in both directions.
FREE Think or Swim Chart link for GBP/JPY


Enjoy Your FREE Think or Swim Chart link for GBP/JPY
"Two spots to watch on GJ, if fib structure can test and hold this could set up beautifully"
Subscribers receive charts for Equities, Indices, Forex, Commodities, etc. including Think or Swim chart links so you can load and use as your own.
But we know seeing is believing so that's why we've included this free link and we also provide a 7-day free trial.
Informational Webinar Recording - Price Action Mastery Certification Course


Host Sean Jantz led the group through the highlights of the course and guest Tom Winterstein provided specific and detailed benefits to traders who enroll in the course.
ChartPros Launches Price Action Mastery Course


Santa Clause Rally...


Wow! What a difference one short year can make. Regardless of your political preferences no one can argue that the past year hasn't been one of the largest all time bull rallies in history.
On December 26, 2018 the S&P ticked at 2316.75 and since then has ripped over 870 points to the upside... YES 870+ and who knows how much higher the markets will continue this surge.
- Page 1 of 2
- Next page