ChartPros Market Insights
Where are the Markets Heading? August 21 Chart of the Day - S&P 500
So often I get asked "Tom, where do you think the market is heading?"
I start by saying the better question is "where could the market be heading?"
Because what I think doesn't matter to price action and no one knows with any certainty where the markets are heading.
I don't make predictions, I don't call tops/bottoms however, I may react to price when it reaches a predetermined level of interest by trading or investing in that particular index, equity, commodity, Forex, etc.
Let's take the S&P 500 for example using it's futures ticker /ES...
S&P 500 (Ticker /ES) Trade Plan for February 23

Forex Grid Trade Plan | February 13, 2023

S&P 500 Trade Plan

Is the S&P 500 Bear Market Over?

By definition, a bear market is when price drops 20% or more from its recent or all time highs. So for the S&P 500 ticker /ES one could say that technically speaking the bear market is over because price is now approximately 15% off the all time high set back in October 2021.
But is the recent run up simply a "Bear Market Rally" or are the bulls firmly back in charge gunning for new all time highs? See this before your next trade!
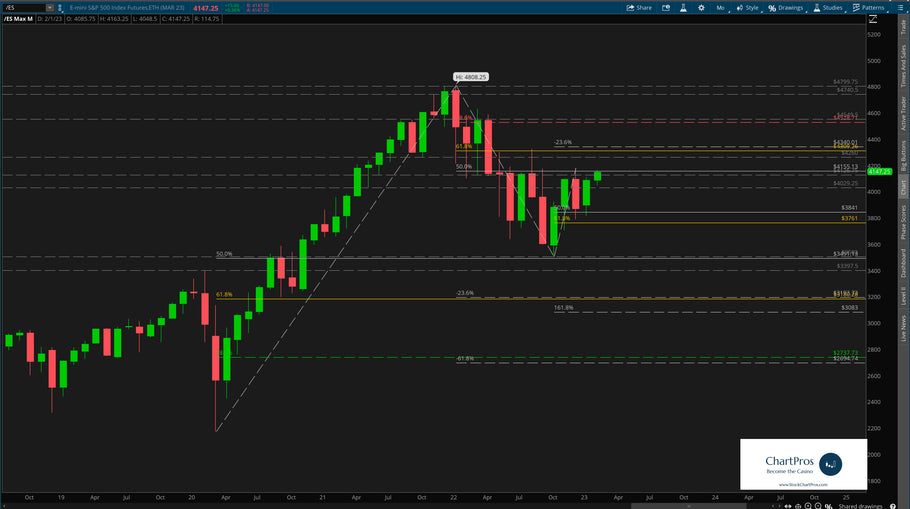
S&P 500 (Ticker /ES) Higher Time Frame Analysis

Follow along with ChartPros Founder Tom Winterstein as he charted in real time and walked through step by step to identify bi-directional levels of interest for the S&P 500 (ticker /ES).
His analysis takes you through the last couple of months of 2022 and into 2023 and you'll see all the details as well as amazingly where price went to versus the anticipated levels so far.
How High Can the Markets Go?

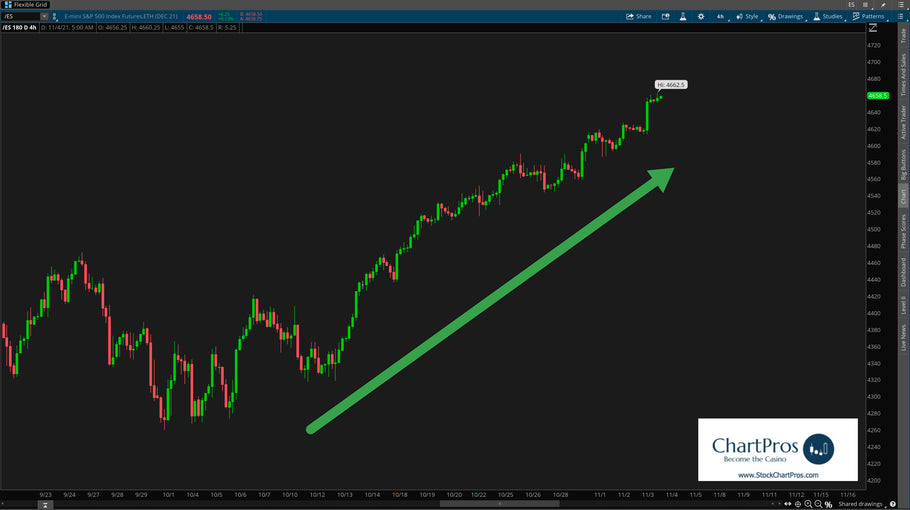
We frequently get asked "How High Can the Markets Go?"
The true answer is no one really knows for sure but technical analysis can help determine potential targets.
Once a market reaches its target there's no telling what can happen then. The prudent thing as a trader is to allow it time to develop new structure.
Price Targets for Oil - $100??


Remember last year when Oil (symbol /CL) went under $7 a barrel? Well if you got long then and stayed long you would have about10x return now...
We hear woulda, shoulda, coulda a lot.
Here are some updated higher time frame upside price targets for Oil. It's not out of the question to see $100 technically speaking.
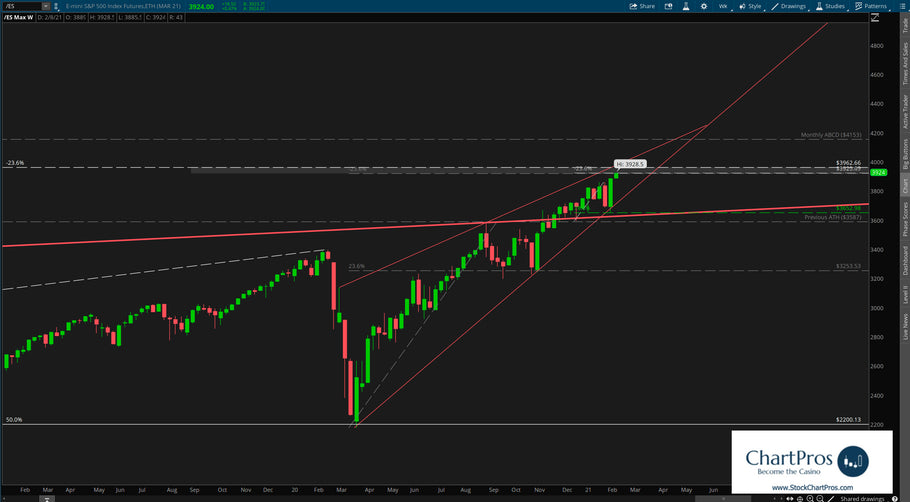
Trade Using Only Support/Resistance and Trend


S&P 500 (/ES) Weekly Chart

Around the Markets - 2 minute outlook for the week of January 31, 2021

Indices Futures Charts and Video Analysis


We wanted to do this higher time frame daily futures grid and video for you on ES, NQ, and YM.
You’ll notice that nothing goes below the daily so not likely to be useful on intraday trades.
- Page 1 of 2
- Next page