ChartPros Market Insights
March 20 Chart of the Day - S&P 500 before FOMC Meeting
Today at 2pm eastern the US Federal Reserve will announce its decision on whether or not to change interest rates. The announcement is followed by a press conference with Fed Chair Jay Powell.
Seems like each one of these interest rate, inflation, or employment related news days lately brings with it more and more volatility with the same old question of "how much higher can the markets go?"
See our planning charts BEFORE the FOMC announcement.
S&P 500 Trade Plan

S&P 500 Recap for February 9, 2023

S&P 500 (Ticker /ES) Higher Time Frame Analysis

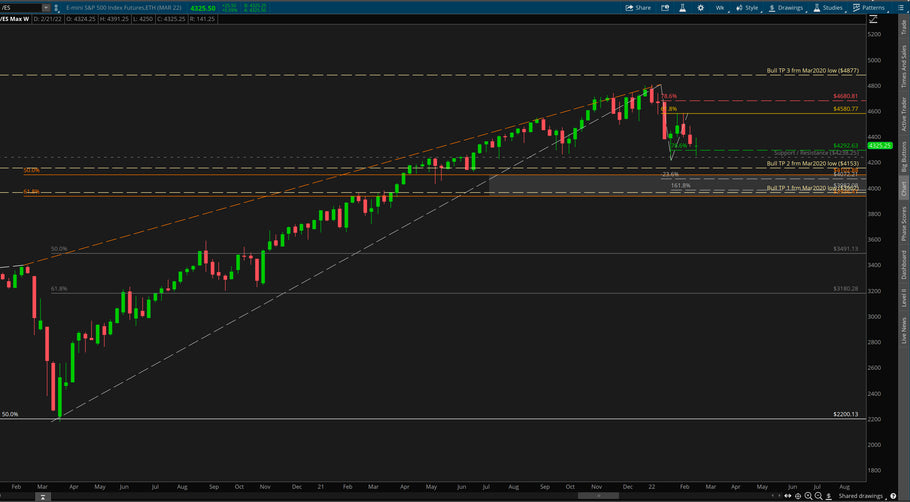
Follow along with ChartPros Founder Tom Winterstein as he charted in real time and walked through step by step to identify bi-directional levels of interest for the S&P 500 (ticker /ES).
His analysis takes you through the last couple of months of 2022 and into 2023 and you'll see all the details as well as amazingly where price went to versus the anticipated levels so far.
S&P 500 Market - Higher Timeframe Technical Analysis

New Year Resolutions for Traders


But what about your trading? Have you made resolutions before? Like have more discipline? More patience? Stop chasing trades? Some may even consider quitting trading altogether? Read more...
How High Can the Markets Go?

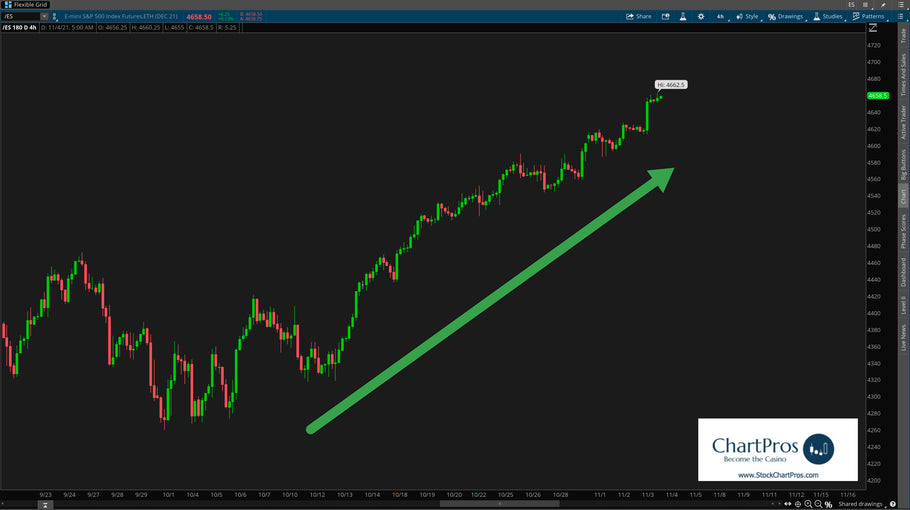
We frequently get asked "How High Can the Markets Go?"
The true answer is no one really knows for sure but technical analysis can help determine potential targets.
Once a market reaches its target there's no telling what can happen then. The prudent thing as a trader is to allow it time to develop new structure.
Is the Market About to Crash?


Price Targets for Oil - $100??


Remember last year when Oil (symbol /CL) went under $7 a barrel? Well if you got long then and stayed long you would have about10x return now...
We hear woulda, shoulda, coulda a lot.
Here are some updated higher time frame upside price targets for Oil. It's not out of the question to see $100 technically speaking.
Trade Using Only Support/Resistance and Trend


Around the Markets - 2 minute outlook for the week of January 31, 2021

Around the Markets - 2 minute outlook for the week of November 15, 2020


- Page 1 of 3
- Next page