ChartPros Market Insights
What is a "Black Swan Event" and How the Next One Could Shake the Financial World (again)


The term "Black Swan" denotes an unexpected financial crisis with profound consequences, merging extreme rarity with a significant impact on stock markets and risk management.
It’s often stated that “history repeats itself.”
Get the inside scoop on how to plan for the best but prepare for the worst.
Trading All Time Highs


Trading all time highs demands more precision when historical reference points begin to disappear.
This Market Insights replay shows traders how to estimate upside targets, identify lower highs, and manage risk when price pushes into less familiar territory.
It also includes a real NVIDIA example to demonstrate how Fibonacci-based analysis can help traders approach all time highs with more confidence, consistency, and a rules-based plan.
I NEVER Believed in Technical Analysis Until I Realized This...


ChartPros founder Tom Winterstein (pictured here in the mid 1980's) reveals the breakthrough moment in his trading career that led him to master price action technical analysis and provides- Proof in Action: A Real-World Example!
Technical Analysis or News?


Remember the recent doom and gloom headlines?
There's been a long running debate between the technical analysis chartists and the fundamentalists and both sides can make their case for being "right". Both sides often think that their way is best and the other side is full of you know what...
Since no one can predict the future how did the recent economic news data this past week "cause" the markets to surge like they did?
Which side are you on? Get the "INSIDE scoop!"
CASE STUDY: Trying to Pass Your Funded Trading Challenge?
We frequently get asked about various funded trading programs and we've reviewed plenty of them but historically never participated in or recommended any of them.
Until recently.
August 5 Chart of the Day - USD/JPY


Why did the global markets drop sharply today? What does it have to do with Japan?
And what is a "carry trade?"
It turns out those questions are all closely related so we'll address them and review the USD/JPY foreign exchange pair from a price action technical analysis perspective.
July 12 Chart of the Day - VIX


The Volatility Index (VIX) moves inversely to the indices and can often be an indicator of upcoming market moves...
Join us as we walk you through the specific details of the correlation between the VIX and the rest of the market and how to incorporate this relationship into your trading style to increase confidence and consistency!
Get Your FREE VIX Trade Entry Timing Course Today!
Is the S&P 500 Bear Market Over?

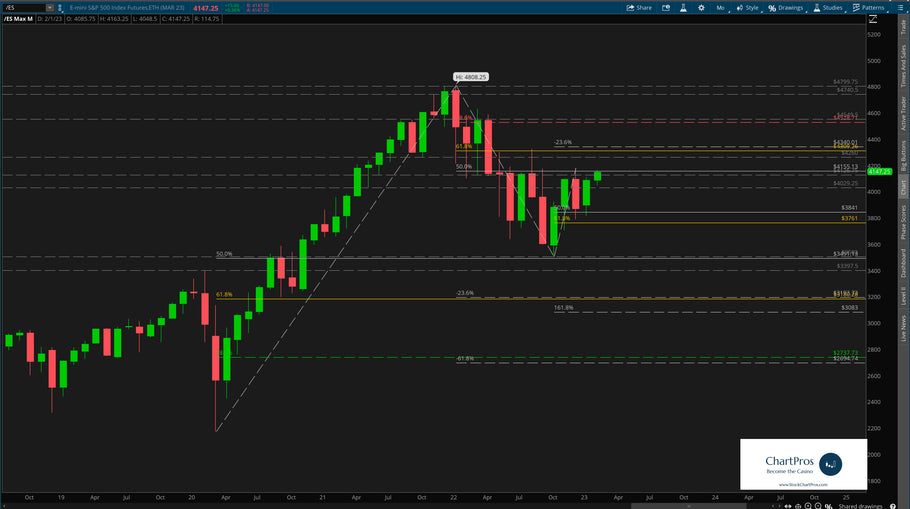
By definition, a bear market is when price drops 20% or more from its recent or all time highs. So for the S&P 500 ticker /ES one could say that technically speaking the bear market is over because price is now approximately 15% off the all time high set back in October 2021.
But is the recent run up simply a "Bear Market Rally" or are the bulls firmly back in charge gunning for new all time highs? See this before your next trade!
S&P 500 Market - Higher Timeframe Technical Analysis

New Year Resolutions for Traders


But what about your trading? Have you made resolutions before? Like have more discipline? More patience? Stop chasing trades? Some may even consider quitting trading altogether? Read more...
ChartPros offers Tradevestor Club Membership and Courses

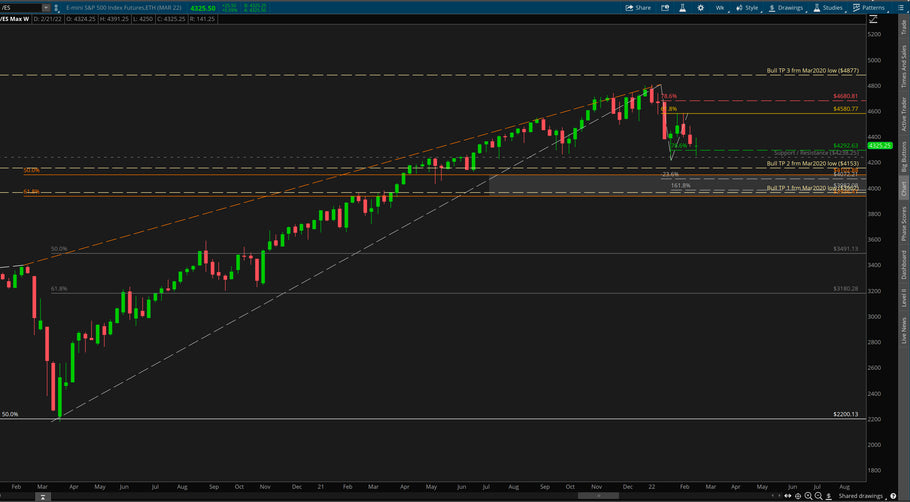
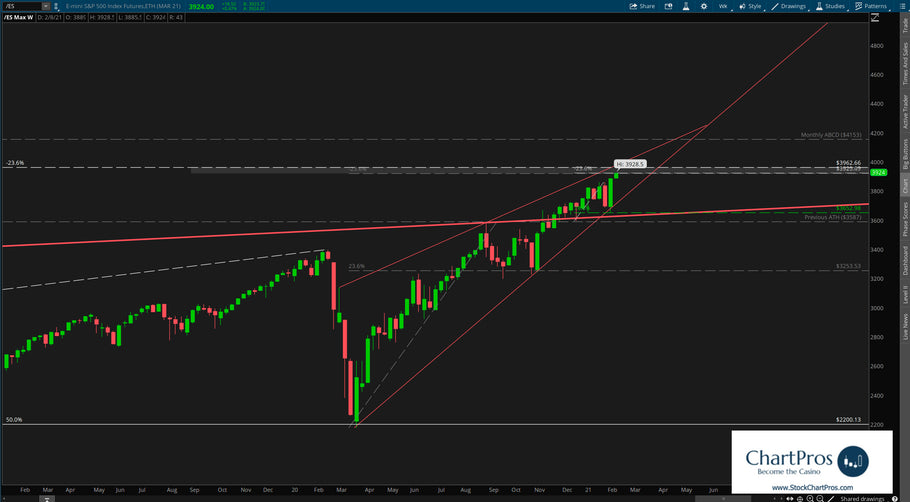
S&P 500 (/ES) Weekly Chart

- Page 1 of 2
- Next page