ChartPros Market Insights
Trading All Time Highs


Trading all time highs demands more precision when historical reference points begin to disappear.
This Market Insights replay shows traders how to estimate upside targets, identify lower highs, and manage risk when price pushes into less familiar territory.
It also includes a real NVIDIA example to demonstrate how Fibonacci-based analysis can help traders approach all time highs with more confidence, consistency, and a rules-based plan.
Technical Analysis or News?


Remember the recent doom and gloom headlines?
There's been a long running debate between the technical analysis chartists and the fundamentalists and both sides can make their case for being "right". Both sides often think that their way is best and the other side is full of you know what...
Since no one can predict the future how did the recent economic news data this past week "cause" the markets to surge like they did?
Which side are you on? Get the "INSIDE scoop!"
CASE STUDY: Trying to Pass Your Funded Trading Challenge?
We frequently get asked about various funded trading programs and we've reviewed plenty of them but historically never participated in or recommended any of them.
Until recently.
July 12 Chart of the Day - VIX


The Volatility Index (VIX) moves inversely to the indices and can often be an indicator of upcoming market moves...
Join us as we walk you through the specific details of the correlation between the VIX and the rest of the market and how to incorporate this relationship into your trading style to increase confidence and consistency!
Get Your FREE VIX Trade Entry Timing Course Today!
Navigating the Markets with Price Action Technical Analysis: Expert Tips for Successful Stocks, Options, Futures, Forex, Crypto, and Commodity Trading


Price action technical analysis is a popular and effective approach to navigating the financial markets, including stocks, options, futures, Forex, Crypto, and Commodity trading.
This article will provide expert tips and insights to help you successfully trade various financial instruments using price action technical analysis. By understanding and applying these concepts, you can improve your trading skills and potentially achieve greater profitability.
April 3 Chart of the Day - UnitedHealth Group
We wanted to review their chart from a price action technical analysis perspective because so many other equities are trading at all time highs (ATH) but this chart is not...
S&P 500 (Ticker /ES) Trade Plan for February 23

S&P 500 Trade Plan

S&P 500 Recap for February 9, 2023

Is the S&P 500 Bear Market Over?

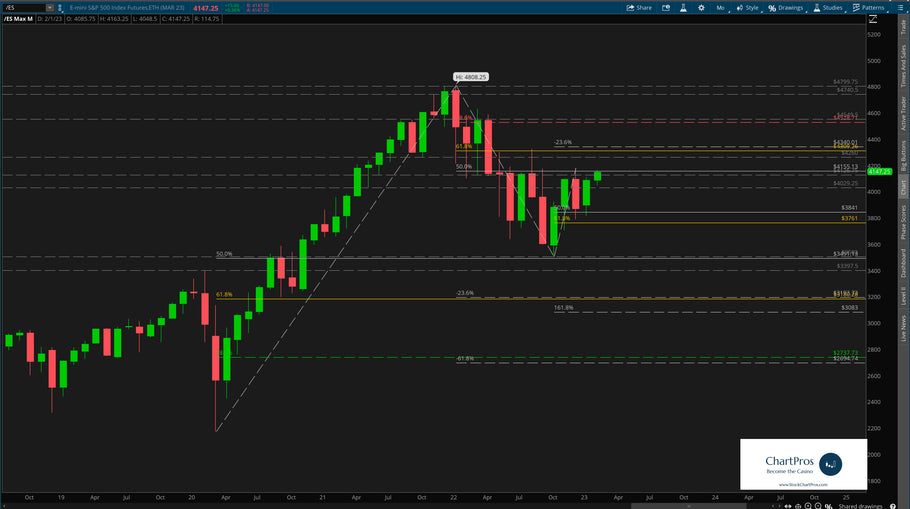
By definition, a bear market is when price drops 20% or more from its recent or all time highs. So for the S&P 500 ticker /ES one could say that technically speaking the bear market is over because price is now approximately 15% off the all time high set back in October 2021.
But is the recent run up simply a "Bear Market Rally" or are the bulls firmly back in charge gunning for new all time highs? See this before your next trade!
S&P 500 (Ticker /ES) Higher Time Frame Analysis

Follow along with ChartPros Founder Tom Winterstein as he charted in real time and walked through step by step to identify bi-directional levels of interest for the S&P 500 (ticker /ES).
His analysis takes you through the last couple of months of 2022 and into 2023 and you'll see all the details as well as amazingly where price went to versus the anticipated levels so far.
FOMC Day = Volatility!


- Page 1 of 3
- Next page