ChartPros Market Insights
Earn Your Price Action Trader Certification in 90 Days!


This program offers a "blended learning" approach, combining self-paced eLearning with expert-led sessions, allowing traders to access the online component immediately upon acceptance.
CASE STUDY: Trying to Pass Your Funded Trading Challenge?
We frequently get asked about various funded trading programs and we've reviewed plenty of them but historically never participated in or recommended any of them.
Until recently.
Have You Ever Thought About Quitting Your Job to Trade Full Time?

Trading is not easy, but can be life changing.
We seldom meet a trader who isn't passionate about generating supplemental income, or even better, someone who desires to quit their day job to become a full time trader.
But many find that can be easy to say but hard to do.
S&P 500 (Ticker /ES) Trade Plan for February 23

Forex Grid Trade Plan | February 13, 2023

S&P 500 Trade Plan

S&P 500 Recap for February 9, 2023

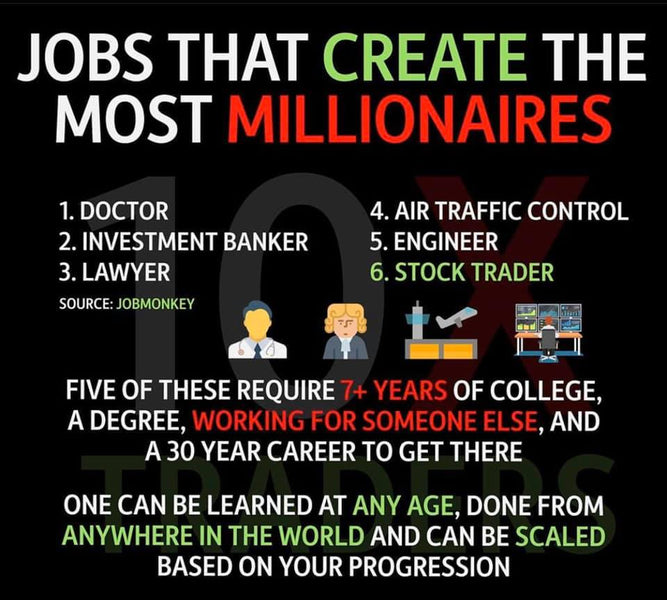
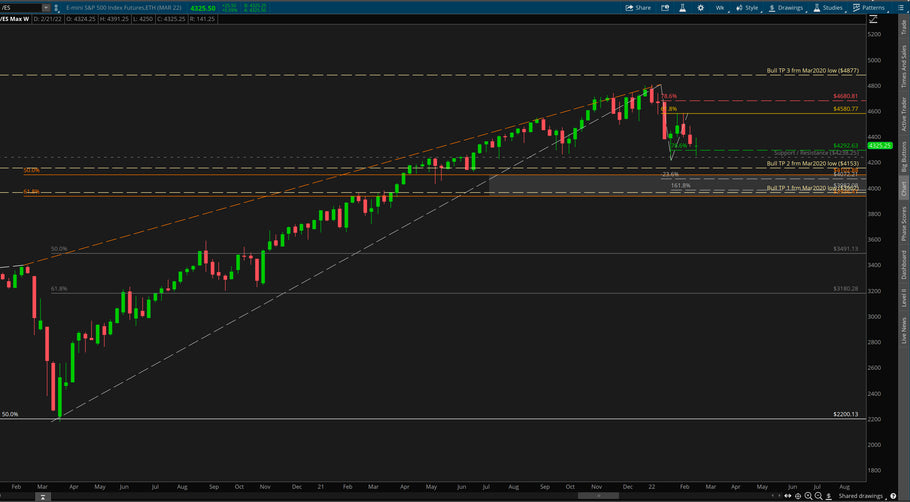
Is the S&P 500 Bear Market Over?

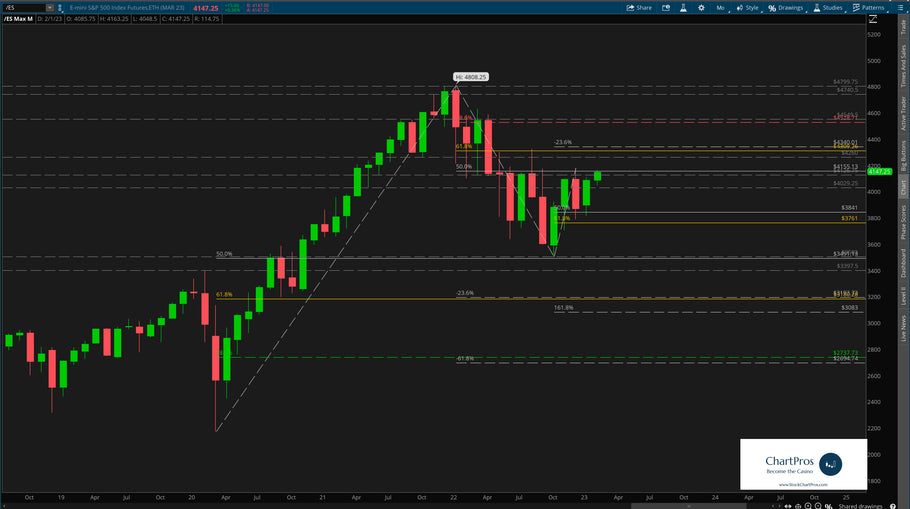
By definition, a bear market is when price drops 20% or more from its recent or all time highs. So for the S&P 500 ticker /ES one could say that technically speaking the bear market is over because price is now approximately 15% off the all time high set back in October 2021.
But is the recent run up simply a "Bear Market Rally" or are the bulls firmly back in charge gunning for new all time highs? See this before your next trade!
S&P 500 (Ticker /ES) Higher Time Frame Analysis

Follow along with ChartPros Founder Tom Winterstein as he charted in real time and walked through step by step to identify bi-directional levels of interest for the S&P 500 (ticker /ES).
His analysis takes you through the last couple of months of 2022 and into 2023 and you'll see all the details as well as amazingly where price went to versus the anticipated levels so far.
The Rise and Fall of Bitcoin from a Price Action Technical Analysis Perspective

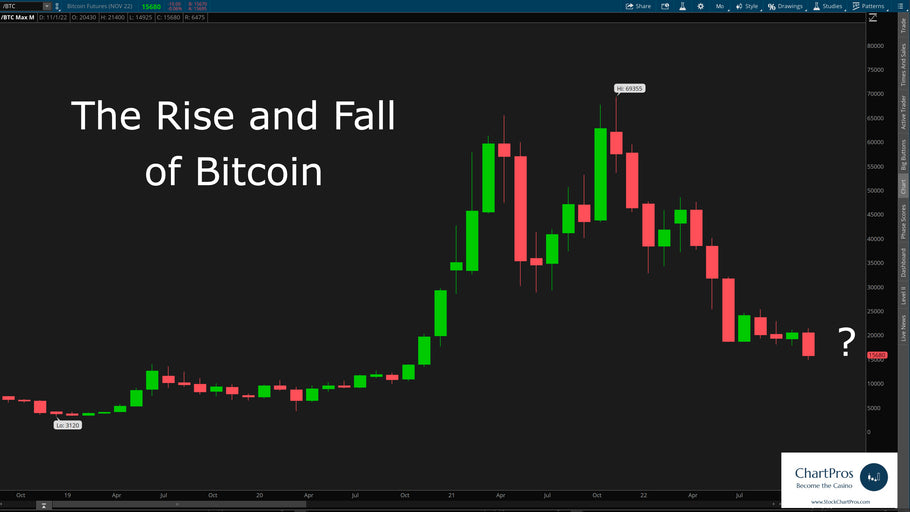
Seems like all the self proclaimed charting experts are suddenly appearing to claim that they "knew" that Bitcoin (ticker BTC) was going to top out and make the free fall that it did... Not so fast my friends!
For well over the past year traders have been asking us what we thought about Bitcoin and our honest answer has consistently been "it doesn't matter what we think about Bitcoin but what's important is what story the BTC chart has been telling us... You just have to know how to listen to it and pickup on the clues that it provides."
S&P 500 Market - Higher Timeframe Technical Analysis

New Year Resolutions for Traders

But what about your trading? Have you made resolutions before? Like have more discipline? More patience? Stop chasing trades? Some may even consider quitting trading altogether? Read more...
- Page 1 of 2
- Next page