ChartPros Market Insights
CASE STUDY: Trying to Pass Your Funded Trading Challenge?
We frequently get asked about various funded trading programs and we've reviewed plenty of them but historically never participated in or recommended any of them.
Until recently.
This is What I'm Binge Watching this Weekend


What I Like to Binge Watch:
- Billions (the hit series on Showtime)
- Shark Tank
- Blue Bloods (my dad is a retired police officer)
- Trading Education Courses...
Yes, Trading Education Courses!
See which ones...
The Top Reasons Why Traders Fail and How to Overcome Common Pitfalls with Effective Trading Rules


This article delves deep into the top reasons why traders fail and how you can overcome these challenges by focusing on your trading process of implementing trading rules, plans, and trading psychology rather than focusing on the outcomes of profits.
ChartPros partners with New Trader University - Steve Burns
ChartPros has become a New Trader University partner which is led by world renowned trader Steve Burns.
Steve plans to feature and highlight ChartPros expertise with Fibonacci and periodically will provide access to ChartPros free trading tips and price action courses.
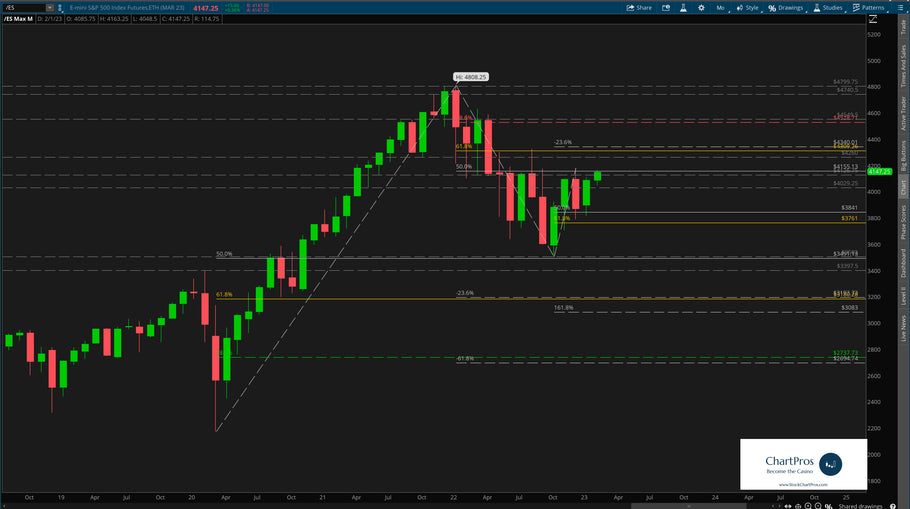
May 30 Chart of the Day - S&P 500

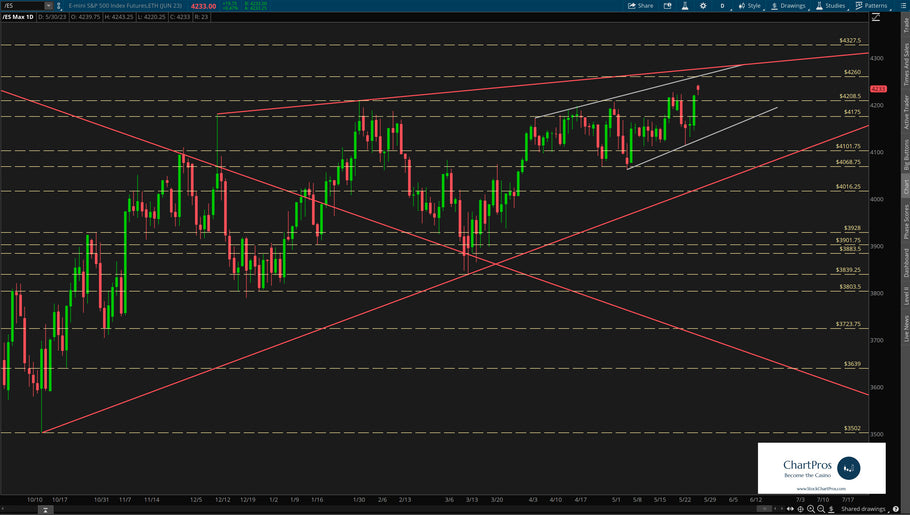
While the New York Stock Exchange (NYSE) was closed Monday in observance of Memorial Day the global after-hours electronic trading system (GLOBEX) opened as normal Sunday evening at 6pm eastern time. And given the US debt ceiling headline news over the long weekend the S&P 500 futures ticker /ES gapped up about 20 points on the open to keep the bulls firmly in control.
On the current ES weekly chart I've only marked it up with Support/Resistance and Trend. Also known as basic structure. In this view traders can see that price often ping pongs between historical levels before proceeding in its next direction.
S&P 500 (Ticker /ES) Trade Plan for February 23

Forex Grid Trade Plan | February 13, 2023

S&P 500 Trade Plan

Is the S&P 500 Bear Market Over?

By definition, a bear market is when price drops 20% or more from its recent or all time highs. So for the S&P 500 ticker /ES one could say that technically speaking the bear market is over because price is now approximately 15% off the all time high set back in October 2021.
But is the recent run up simply a "Bear Market Rally" or are the bulls firmly back in charge gunning for new all time highs? See this before your next trade!
FOMC Day = Volatility!


Market have you feeling down after that sell off?

Market have you feeling down after that big sell off? Did you like many others try to catch that falling knife?
Learn what over 4K other traders have in ChartPros Price Action Mastery certification course to become more confident and consistent with your trading results.
New Year Resolutions for Traders


But what about your trading? Have you made resolutions before? Like have more discipline? More patience? Stop chasing trades? Some may even consider quitting trading altogether? Read more...
- Page 1 of 3
- Next page