ChartPros Market Insights
I NEVER Believed in Technical Analysis Until I Realized This...


ChartPros founder Tom Winterstein (pictured here in the mid 1980's) reveals the breakthrough moment in his trading career that led him to master price action technical analysis and provides- Proof in Action: A Real-World Example!
Free Guide: 6 Fibonacci Types that Create the Most Precise Price Targets and Reversal Zones


Most Fibonacci charts that we see posted on the internet are not drawn or used correctly.
Based on institutional algorithms this Free Guide will explain to you exactly what Fibonacci retracements and extensions are and how they should properly be used on your charts.
Navigating the Markets with Price Action Technical Analysis: Expert Tips for Successful Stocks, Options, Futures, Forex, Crypto, and Commodity Trading


Price action technical analysis is a popular and effective approach to navigating the financial markets, including stocks, options, futures, Forex, Crypto, and Commodity trading.
This article will provide expert tips and insights to help you successfully trade various financial instruments using price action technical analysis. By understanding and applying these concepts, you can improve your trading skills and potentially achieve greater profitability.
January 8 Chart of the Day - Alaska Airlines
You may have heard that passengers aboard an Alaska Airlines (ALK) flight last week experienced a major scare, as an emergency exit-sized gap suddenly appeared in the side of the plane, leading to a rapid decompression. The plane was en route from Portland to Ontario, California, when the incident occurred.
As per a report by The Wall Street Journal, the flight took off on Friday afternoon and was forced to return to Portland International Airport within 30 minutes. The plane, at 16,000 feet, had 171 passengers and six crew members on board, all of whom survived the frightening ordeal.
Thank God everyone survived!
This has put the airline as well as the plane's manufacturer Boeing (BA Chart of the Day on 12/8/2023) squarely in the headlines with a lot of scrutiny on safety. As a result, both company's respective stock prices are trading down today.
May 30 Chart of the Day - S&P 500

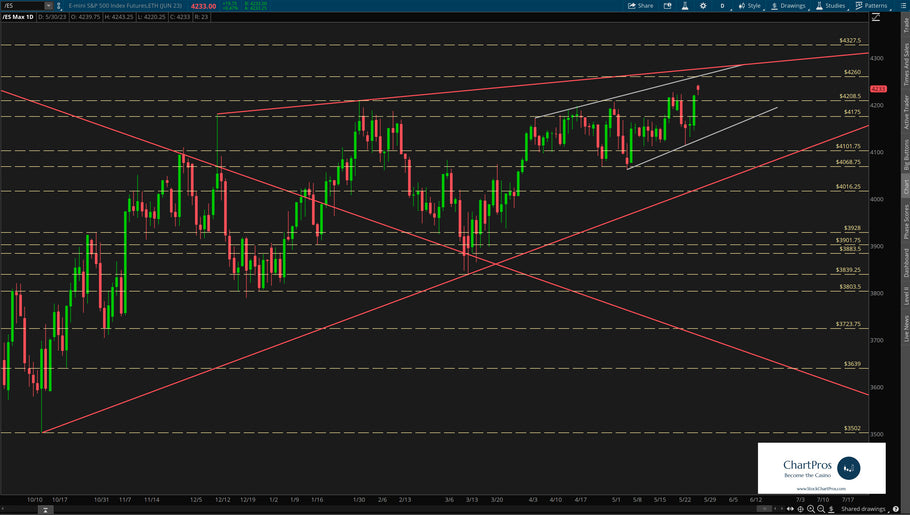
While the New York Stock Exchange (NYSE) was closed Monday in observance of Memorial Day the global after-hours electronic trading system (GLOBEX) opened as normal Sunday evening at 6pm eastern time. And given the US debt ceiling headline news over the long weekend the S&P 500 futures ticker /ES gapped up about 20 points on the open to keep the bulls firmly in control.
On the current ES weekly chart I've only marked it up with Support/Resistance and Trend. Also known as basic structure. In this view traders can see that price often ping pongs between historical levels before proceeding in its next direction.
Instant Access to FREE Guide: 6 Fibonacci Types that Create the Most Precise Price Targets and Reversal Zones

Fibonacci, often referred to as “Fibs”, are one of the most commonly used tools in Price Action Trading for trending markets in helping create measured price movements which can assist you in creating bi-directional future levels of interest and anticipate trend reversal zones.
This free guide will explain to you exactly what Fibonacci retracements and extensions are and how they should properly be used on your charts.