ChartPros Market Insights
How High Can the Markets Go?

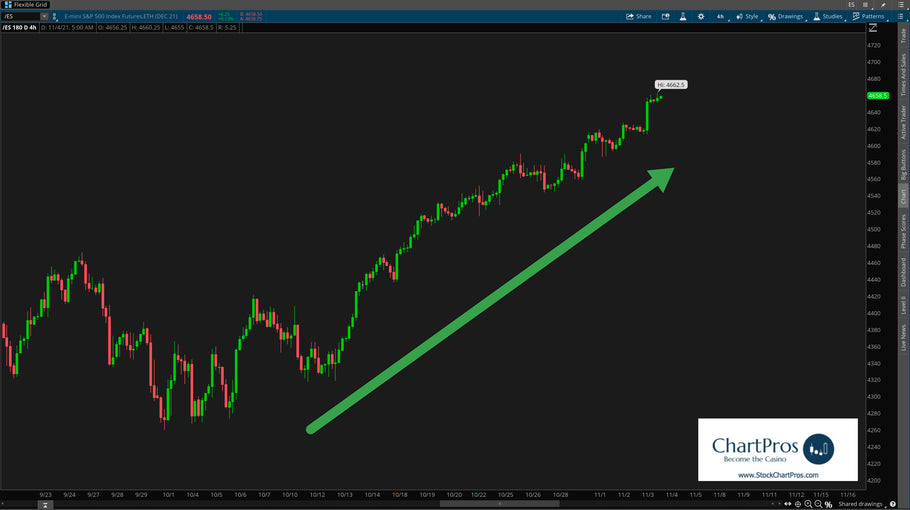
We frequently get asked "How High Can the Markets Go?"
The true answer is no one really knows for sure but technical analysis can help determine potential targets.
Once a market reaches its target there's no telling what can happen then. The prudent thing as a trader is to allow it time to develop new structure.
ChartPros offers Tradevestor Club Membership and Courses

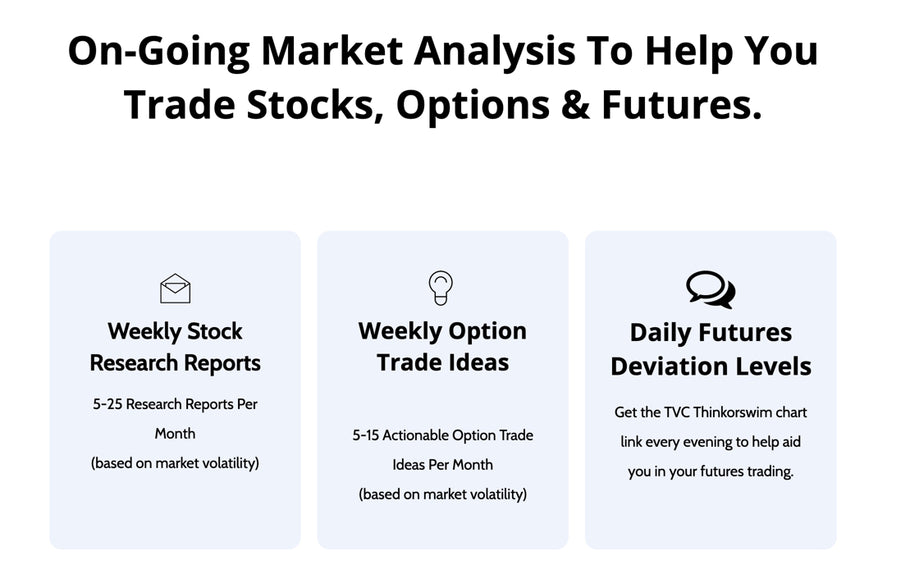
Trade Using Only Support/Resistance and Trend


Around the Markets - 2 minute outlook for the week of January 31, 2021

Market Calm Before the Election Storm... What to Anticipate


Advanced Futures Course with Michael Perrigo


ChartPros launched its latest market education leading course "Advanced Futures".
This course takes traders through advanced strategies and preparations for trading indice futures.
The course is broken into three sections and will walk traders through step by step some of the most advanced strategies and techniques for day and swing trading.
Traders are going to learn how to identify Fibonacci sequences used by institutional algorithms and how to leverage that knowledge in your trading.
We're also going to provide insights into risk management and how to create "risk free" trade scenarios.
Lastly, we take traders through some trade planning and trade recaps that apply the techniques taught in the course.
Indices Futures Charts and Video Analysis


We wanted to do this higher time frame daily futures grid and video for you on ES, NQ, and YM.
You’ll notice that nothing goes below the daily so not likely to be useful on intraday trades.
Anatomy of a Potential Entry


A frequently asked question we get so often is how do we determine a potential entry level where there are multiple levels of interest within a particular zone or area.
So here is a brief 4 minute video on the Anatomy of a Potential Entry on USD/CAD for June 8, 2020.
Could be an Interesting week or two for /YM


The traders in our Price Action Mastery Course are learning first hand the power of the markets and in particular how technical analysis can benefit them.
During the first week of April we identified a level for a long swing trade entry. Since then we've been tracking and managing the trade. Now, as price is approaching our bull profit targets it will be interesting to see how price reacts to what could be potential resistance.
Yes, that's about a 4000+ point hold to the long side. This is what is taught in the course for both swing and shorter term trades. It is not uncommon for us to be long in our swing account but short in our intraday account to capitalize on the levels of interest we've identified for the respective time frames.
I Taught My Nervous Neighbor How to Start Trading the Markets and Begin Making Extra Money Each Week!


So my nervous neighbor was asking about the markets last week... this is what I said... LOOK OUT BELOW!!!
Regardless if price goes up, down, or sideways we like to be prepared with actionable levels. Today is no different.
FREE Think or Swim Chart link for GBP/JPY


Enjoy Your FREE Think or Swim Chart link for GBP/JPY
"Two spots to watch on GJ, if fib structure can test and hold this could set up beautifully"
Subscribers receive charts for Equities, Indices, Forex, Commodities, etc. including Think or Swim chart links so you can load and use as your own.
But we know seeing is believing so that's why we've included this free link and we also provide a 7-day free trial.
Informational Webinar Recording - Price Action Mastery Certification Course


Host Sean Jantz led the group through the highlights of the course and guest Tom Winterstein provided specific and detailed benefits to traders who enroll in the course.