ChartPros Market Insights
From Uncertain to Unstoppable: Get the Exact Steps to Build Confidence as a Trader


Trading in the markets can feel like riding a rollercoaster blindfolded. One minute you're on top of the world, the next you're questioning every decision you've ever made.
Sound familiar?
You're not alone.
Let's embark on a journey from self-doubt to self-assurance, transforming you from an uncertain trader to an unstoppable force in the market.
Get the Exact Steps to Build Confidence as a Trader
Align Actions to Trading Goals and Focus on Process Rather than Outcome


If you're looking to grow a small account, seriously supplement your income, or perhaps leave your day job behind then get on board with these FREE tips, strategies, and courses that could boost your trading performance!
Join over 25,000+ other traders who are using ChartPros as an important part of their trading process.
This is What I'm Binge Watching this Weekend


What I Like to Binge Watch:
- Billions (the hit series on Showtime)
- Shark Tank
- Blue Bloods (my dad is a retired police officer)
- Trading Education Courses...
Yes, Trading Education Courses!
See which ones...
The Top Reasons Why Traders Fail and How to Overcome Common Pitfalls with Effective Trading Rules


This article delves deep into the top reasons why traders fail and how you can overcome these challenges by focusing on your trading process of implementing trading rules, plans, and trading psychology rather than focusing on the outcomes of profits.
July 12 Chart of the Day - VIX


The Volatility Index (VIX) moves inversely to the indices and can often be an indicator of upcoming market moves...
Join us as we walk you through the specific details of the correlation between the VIX and the rest of the market and how to incorporate this relationship into your trading style to increase confidence and consistency!
Get Your FREE VIX Trade Entry Timing Course Today!
Navigating the Markets with Price Action Technical Analysis: Expert Tips for Successful Stocks, Options, Futures, Forex, Crypto, and Commodity Trading


Price action technical analysis is a popular and effective approach to navigating the financial markets, including stocks, options, futures, Forex, Crypto, and Commodity trading.
This article will provide expert tips and insights to help you successfully trade various financial instruments using price action technical analysis. By understanding and applying these concepts, you can improve your trading skills and potentially achieve greater profitability.
Monthly S&P 500 Chart


Have You Ever Thought About Quitting Your Job to Trade Full Time?

Trading is not easy, but can be life changing.
We seldom meet a trader who isn't passionate about generating supplemental income, or even better, someone who desires to quit their day job to become a full time trader.
But many find that can be easy to say but hard to do.
Happy New Year! 2024 New Year Resolutions...


Traditionally, many people make New Year's resolutions. Some promise themselves that they'll eat better, lose weight, behave nicer, stop bad habits, start new habits... You've probably been there done that.
But what about your trading? Have you made resolutions before? Like have more discipline? More patience? Stop chasing trades? Some may even consider quitting trading altogether?
See what our New Year resolutions are...
See How This ChartPros Trade Room Member Used Apex Trader Funding to Earn Over $1M in the last year!


Vince Koehn, a long time ChartPros Trade Room member talks about his success with Apex Funded Trader program.
We frequently get asked about various funded trading programs and we've reviewed plenty of them but historically never participated in or recommended any of them.
Until recently.
ChartPros partners with New Trader University - Steve Burns
ChartPros has become a New Trader University partner which is led by world renowned trader Steve Burns.
Steve plans to feature and highlight ChartPros expertise with Fibonacci and periodically will provide access to ChartPros free trading tips and price action courses.
May 30 Chart of the Day - S&P 500

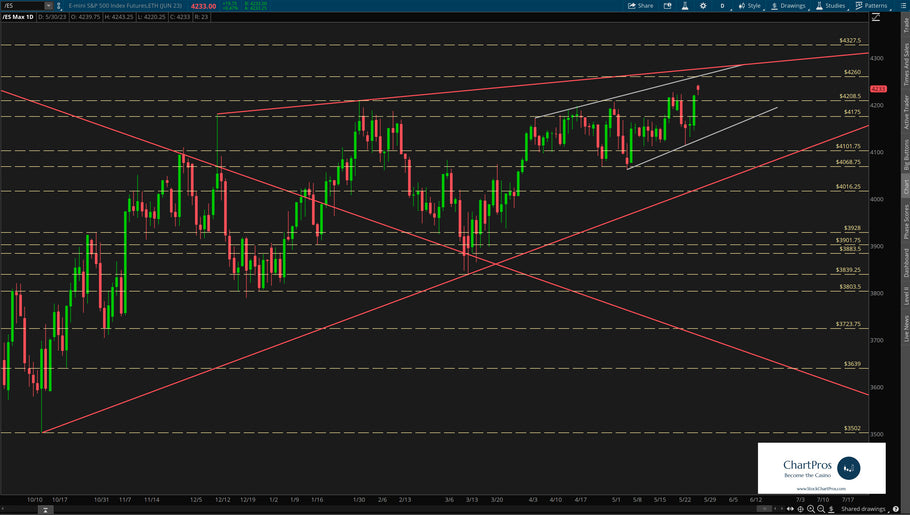
While the New York Stock Exchange (NYSE) was closed Monday in observance of Memorial Day the global after-hours electronic trading system (GLOBEX) opened as normal Sunday evening at 6pm eastern time. And given the US debt ceiling headline news over the long weekend the S&P 500 futures ticker /ES gapped up about 20 points on the open to keep the bulls firmly in control.
On the current ES weekly chart I've only marked it up with Support/Resistance and Trend. Also known as basic structure. In this view traders can see that price often ping pongs between historical levels before proceeding in its next direction.
- Previous page
- Page 2 of 5
- Next page