ChartPros Market Insights
Bear Market Trading Strategies (and their Steep Bull Rallies) Webinar


You'll see the only Price Action tools needed that are native to every charting platform and how to apply them in the current volatile conditions.
As a BONUS participants will be introduced to the ChartPros Trade Entry Timing Tool that can be used anticipate market moves across a variety of timeframes and trading styles!
Recorded Thursday November 3rd, 2022 04:30 PM Eastern Time
S&P 500 Market - Higher Timeframe Technical Analysis

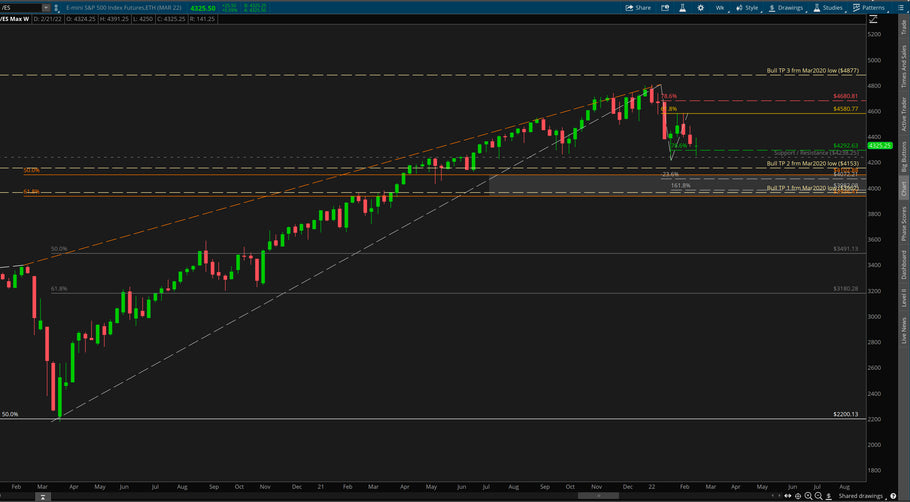
S&P /ES Higher Time Frame Chart - Technical Analysis for February 23, 2022
Is the Market About to Crash?


Yeah, market sentiment can be tricky to try and figure out. One thing I see or hear over and over again are statements that begin with "I feel like..." and you can fill in the blank like:
Price Targets for Oil - $100??


Remember last year when Oil (symbol /CL) went under $7 a barrel? Well if you got long then and stayed long you would have about10x return now...
We hear woulda, shoulda, coulda a lot.
Here are some updated higher time frame upside price targets for Oil. It's not out of the question to see $100 technically speaking.
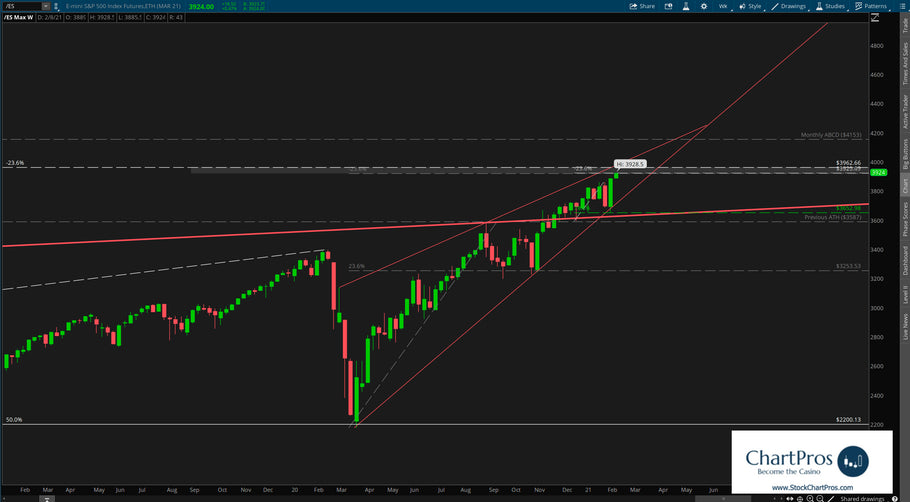
Trade Using Only Support/Resistance and Trend


We often get asked "can I trade without knowing more advanced charting techniques like Fibonacci?" And simply stated the answer is yes!
S&P 500 (/ES) Weekly Chart

When the next down cycle comes, and it will definitely come at some point caused by “something” we’re likely to experience some higher time frame technically correct pull backs like we saw in March 2020.
Around the Markets - 2 minute outlook for the week of January 31, 2021


2 minute market outlook for the week of January 31, 2021 for /ES, /NQ, /YM, and /VX
Discover Top Trading Psychology & Mindset Techniques Webinar Recording


Join ChartPros and learn top trading psychology and mindset techniques used by the most successful traders in the industry. Attend this session to discover how applying these practices can improve both trading confidence and consistency.
- Previous page
- Page 2 of 2