ChartPros Market Insights
New Year Resolutions for Traders

But what about your trading? Have you made resolutions before? Like have more discipline? More patience? Stop chasing trades? Some may even consider quitting trading altogether? Read more...
How High Can the Markets Go?

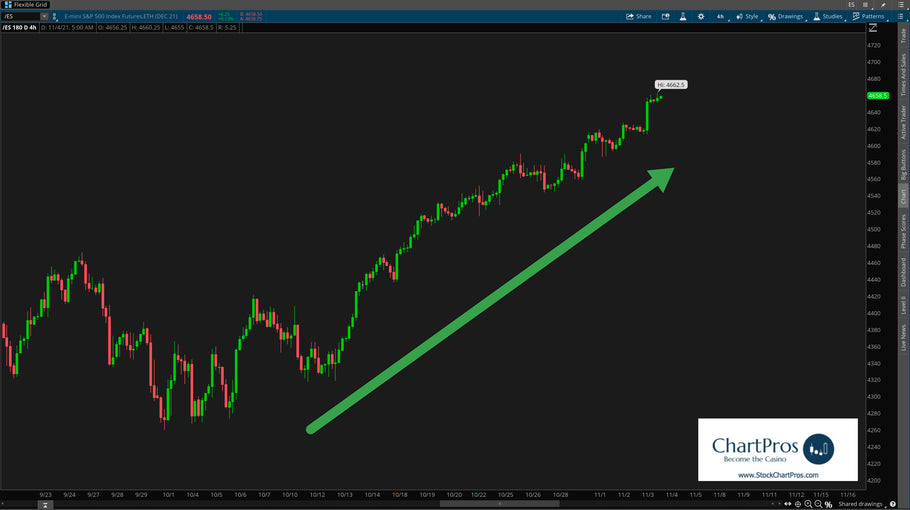
We frequently get asked "How High Can the Markets Go?"
The true answer is no one really knows for sure but technical analysis can help determine potential targets.
Once a market reaches its target there's no telling what can happen then. The prudent thing as a trader is to allow it time to develop new structure.
Is the Market About to Crash?


Price Targets for Oil - $100??


Remember last year when Oil (symbol /CL) went under $7 a barrel? Well if you got long then and stayed long you would have about10x return now...
We hear woulda, shoulda, coulda a lot.
Here are some updated higher time frame upside price targets for Oil. It's not out of the question to see $100 technically speaking.
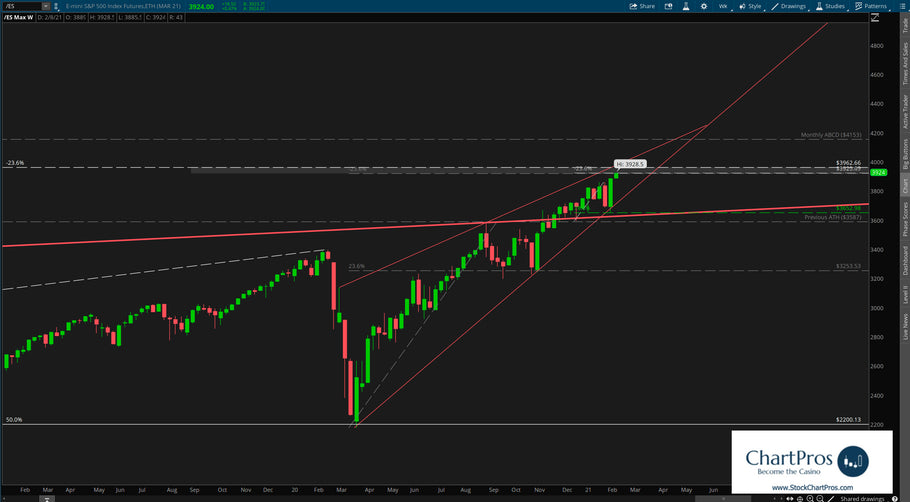
Trade Using Only Support/Resistance and Trend


S&P 500 (/ES) Weekly Chart

Around the Markets - 2 minute outlook for the week of January 31, 2021

Discover Top Trading Psychology & Mindset Techniques Webinar Recording


Around the Markets - 2 minute outlook for the week of November 15, 2020


Market Calm Before the Election Storm... What to Anticipate


Advanced Futures Course with Michael Perrigo


ChartPros launched its latest market education leading course "Advanced Futures".
This course takes traders through advanced strategies and preparations for trading indice futures.
The course is broken into three sections and will walk traders through step by step some of the most advanced strategies and techniques for day and swing trading.
Traders are going to learn how to identify Fibonacci sequences used by institutional algorithms and how to leverage that knowledge in your trading.
We're also going to provide insights into risk management and how to create "risk free" trade scenarios.
Lastly, we take traders through some trade planning and trade recaps that apply the techniques taught in the course.
How to Use 5 Price Action Tools to Boost Your Confidence and Improve Your Consistency


- Previous page
- Page 2 of 3
- Next page