ChartPros Market Insights
May 30 Chart of the Day - S&P 500

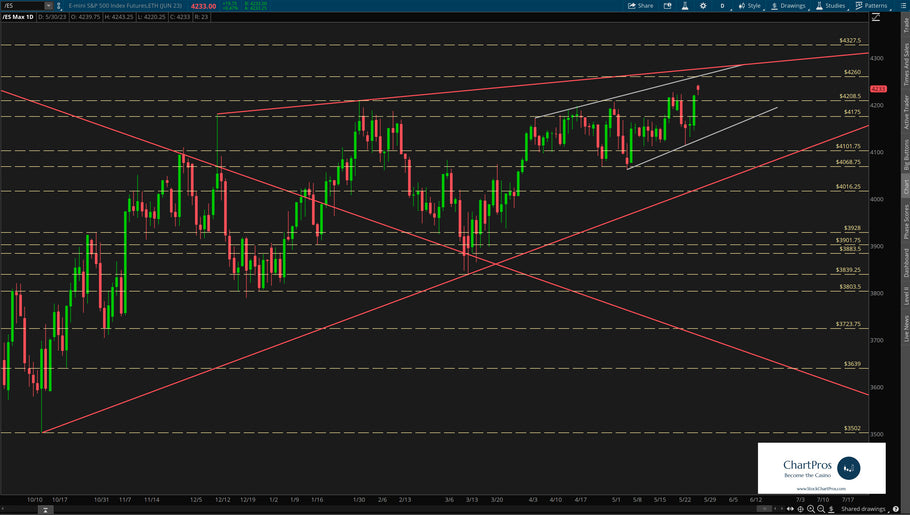
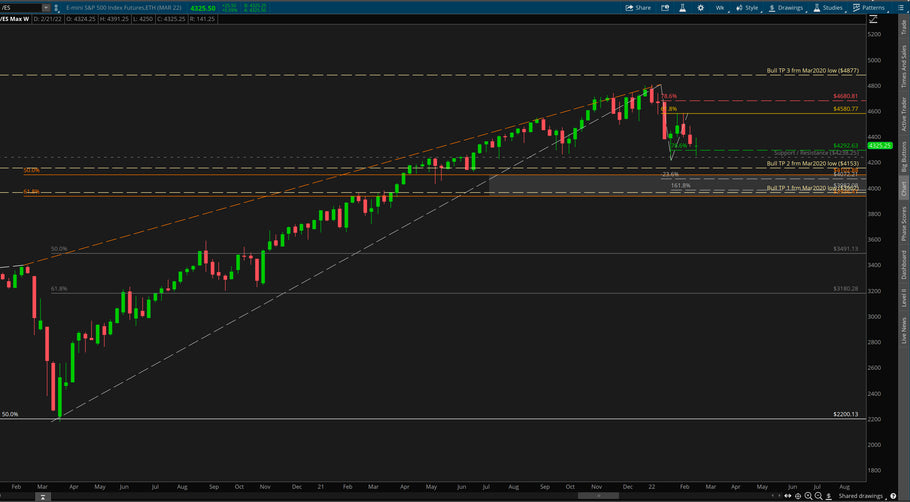
While the New York Stock Exchange (NYSE) was closed Monday in observance of Memorial Day the global after-hours electronic trading system (GLOBEX) opened as normal Sunday evening at 6pm eastern time. And given the US debt ceiling headline news over the long weekend the S&P 500 futures ticker /ES gapped up about 20 points on the open to keep the bulls firmly in control.
On the current ES weekly chart I've only marked it up with Support/Resistance and Trend. Also known as basic structure. In this view traders can see that price often ping pongs between historical levels before proceeding in its next direction.
S&P 500 (Ticker /ES) Trade Plan for February 23

S&P 500 Recap for February 9, 2023

Is the S&P 500 Bear Market Over?

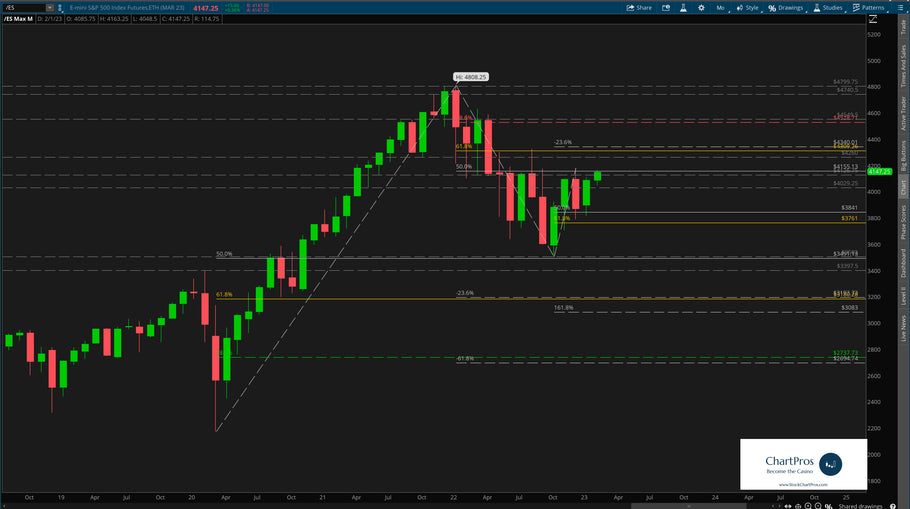
By definition, a bear market is when price drops 20% or more from its recent or all time highs. So for the S&P 500 ticker /ES one could say that technically speaking the bear market is over because price is now approximately 15% off the all time high set back in October 2021.
But is the recent run up simply a "Bear Market Rally" or are the bulls firmly back in charge gunning for new all time highs? See this before your next trade!
Bear Market Trading Strategies (and their Steep Bull Rallies) Webinar


You'll see the only Price Action tools needed that are native to every charting platform and how to apply them in the current volatile conditions.
As a BONUS participants will be introduced to the ChartPros Trade Entry Timing Tool that can be used anticipate market moves across a variety of timeframes and trading styles!
Recorded Thursday November 3rd, 2022 04:30 PM Eastern Time
S&P 500 Market - Higher Timeframe Technical Analysis

New Year Resolutions for Traders


But what about your trading? Have you made resolutions before? Like have more discipline? More patience? Stop chasing trades? Some may even consider quitting trading altogether? Read more...
How High Can the Markets Go?

We frequently get asked "How High Can the Markets Go?"
The true answer is no one really knows for sure but technical analysis can help determine potential targets.
Once a market reaches its target there's no telling what can happen then. The prudent thing as a trader is to allow it time to develop new structure.
Is the Market About to Crash?


S&P 500 (/ES) Weekly Chart

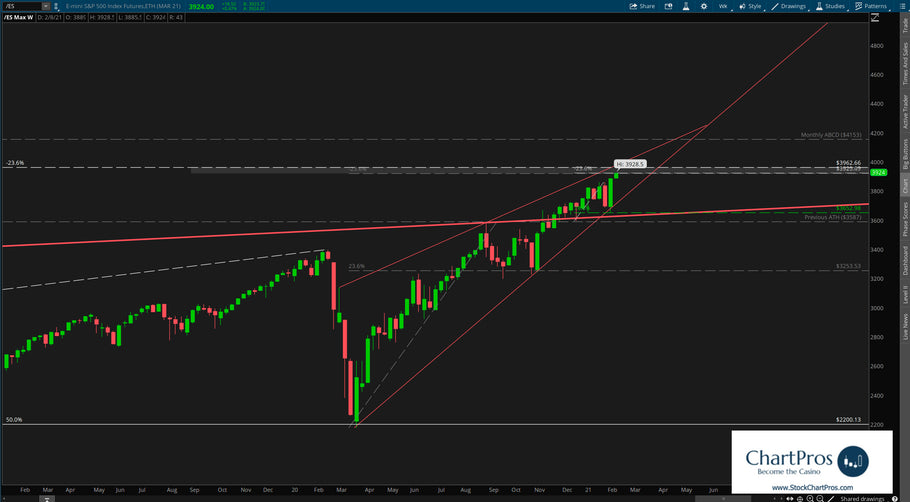
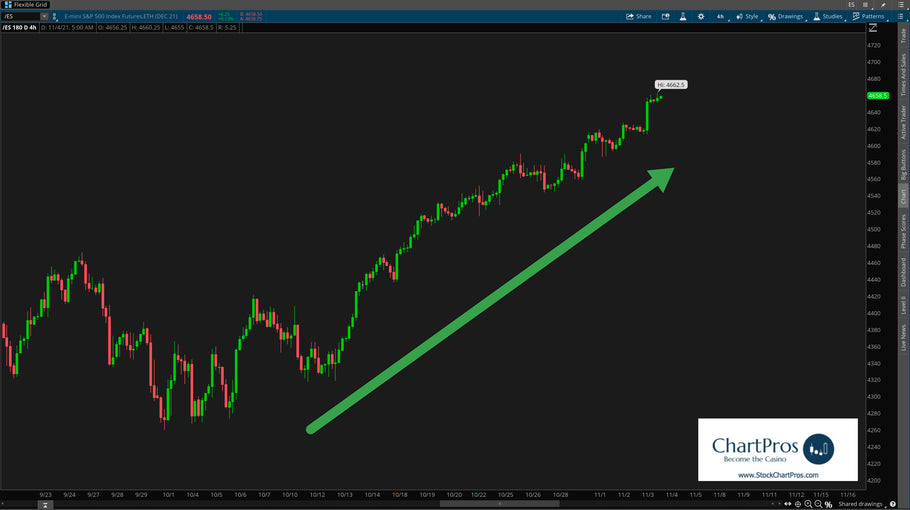
Around the Markets - 2 minute outlook for the week of January 31, 2021

Around the Markets - 2 minute outlook for the week of November 15, 2020


- Previous page
- Page 2 of 3
- Next page